This page contains math equations and images. If you cannot see either of them on this page, try loading the page on a different web browser.
This lab introduces the Graphics Library for RISC-V (GLIR) and provides practice implementing algorithms in RISC-V assembly code.
Sorting algorithms are fundamental tools in Computing Science and are used to arrange elements in a specific order. There are many different sorting algorithms, each have their own way of sorting the elements. A sorting visualizer allows us to see how a sorting algorithm works by visualizing the elements and how they are shifted around. This lab will implement the insertion-sort algorithm and visualize it using GLIR. This sorting visualizer will be a simpler version of the visualizers that can be found online. Here are some examples of sorting visualizers that you can find online.
Write a RISC-V program that sorts an array of numbers, in-place, in ascending order using insertion sort and display the movement of the elements by highlighting them on the terminal with GLIR. Your program should dynamically calculate the position of the separator, the height of each bar/element, and its color. Your program should also be able to handle arrays of different sizes.
Insertion sort is a sorting algorithm that places an unsorted element at its suitable place in each iteration.
Insertion sort works similarly to how playing cards are sorted in a hand. Assume that the first card is already sorted, then select the next unsorted card. If the unsorted card is greater than the card in hand, place it on the right, otherwise place it to the left. Move to the next unsorted card and put it in its right place. This is the same algorithm used by insertion sort.
Below is the pseudocode for insertion sort with the draw calls highlighted in yellow:
visualize_sort(array)
  mark first element as sorted
  for each unsorted element X
    draw the array, 'highlighting' the element X (before insertion)
    'extract' the element X
    for j <- lastSortedIndex down to 0
      if current element j > X
        move sorted element to the right by 1
    break loop and insert X here
    draw the array, 'highlighting' the element X (after insertion)
end visualize_sort
Credit: Insertion Sort Algorithm (Programiz)
The highlighted part of the pseudocode calls the
draw function which will be discussed in a later section.
The solution for this lab will sort the array in ascending order (from the smallest item to the largest item, going from left to right) and in-place. In other words, modify the original array; do not create a new array.
GLIR is a collection of subroutines to emulate graphics in a terminal.
This lab uses the
GLIR_PrintOVLine subroutine
to print the vertical lines representing the elements in the array.
GLIR works by printing cells onto the terminal window. The terminal window is represented as a grid of rows and columns:
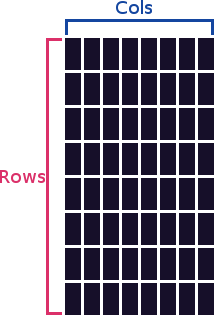
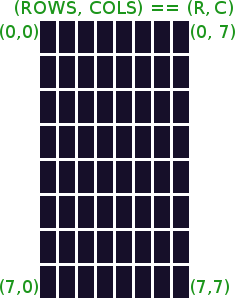
The tuple representing a position on the grid is (R, C) and not (C, R) -- where R represents a row and C a column. This is because terminals were designed to print text top to bottom, left to right. The origin (0, 0) is at the top left of the terminal window:
The code provided in the common.s file calls two GLIR
functions. One before the visualizer is called, and one after.
GLIR_Start: This function must be called before the visualizer to prepare the
terminal for the visualizer:
GLIR_End: This function must be called after the visualizer to revert the
terminal back to its default state:
There are multiple ways to display updates on the screen. This lab used the following overlapping method:
Step 3 can be achieved using the
GLIR_PrintOVLine subroutine.
GLIR_PrintOVLine
This subroutine prints an overlapping vertical line on the terminal. It will overlap whatever is underneath the line with a new line. This works by printing the default color of the terminal over the line and then printing the new line over it. The default color of the terminal is black, unless it is changed by the user.
Prints an overlapping vertical line on the terminal.

Arguments:
  a0: The line column position
  a1: The row where the line starts
  a2: The row where the line ends
  a3: The color of the line

Returns:
  None
a1 and a2 can be
interchanged. They are also inclusive, meaning that the specified rows
a1 and a2 will be printed onto the terminal.
The sorting visualizer implemented in this lab handles positive and negative numbers and has has three main components: the separator, the height of the bars, and the color of the bars. It must also highlight the current element being inserted and show where it gets inserted. See example output.
The divisions in Separator and
Bar Height are integer divisions. To
achieve integer division in RISC-V, use the
div instruction. This operation rounds the quotient
towards 0.
The max_range function will be useful to compute the
position of the separator even if the array contains only negative
numbers or only positive numbers.
Here is the definition of \(max\_range\):
$$max\_range=\left\{ \begin{array}{ll} \max(a)-\min(a) & \max(a)>0\ \&\ \min(a)<0 \\ \max(a) & \max(a)>0\ \&\ \min(a)>0 \\ |\min(a)| & \max(a)<0\ \&\ \min(a)<0 \\ \end{array} \right.$$
where \(a\) is the array of numbers, \(\max(a)\) is the the greatest element in the array, \(\min(a)\) is the smallest element in the array, and \(|\min(a)|\) is the absolute value of the smallest element in the array.
Neither \(max(a)\) nor \(min(a)\) will be 0 because all elements in the array will be non-zero. See Input Guarantees.
The visualizar has a horizontal separator that divides the screen into a positive region above and a negative region below. The position of the separator in the screen is determined by the values of the maximum positive and the maximum negative elements of the array. For instance, if the largest element is 100 and the smallest element is -1, then the separator will be located near the bottom of the screen. Below is the formula used to calculate in which row the separator should be located on the screen:
$$separator\_pos = \frac{\max(0,\ \max(a)) \times (r-2)}{max\_range}$$
where \(a\) is the array of numbers, \(\max(a)\) is the maximum element in the array, and \(r\) is the number of rows on the terminal.
Note that in this lab \(r\) will always be 42. See Input Guarantees.
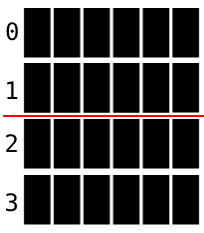
In this visualizer, the separator is not drawn, it is an imaginary line
between rows \(separator\_pos\) and \(separator\_pos+1\). For example,
here is what the imaginary line (red line), representing the separator,
will look like if it is located at row 1:
The height of the bars on the visualizer will be relative to one another, thus the largest number will have the highest bar and the smallest number will have the lowest bar. Below is the formula used to calculate the height of the bar of a given element from the separator calculated before:
$$bar\_height=\frac{x \times (r-2)}{max\_range}$$
where \(x\) is the given element, and \(r\) is the number of rows on the terminal.
In this lab \(r\) is always 42. See Input Guarantees.
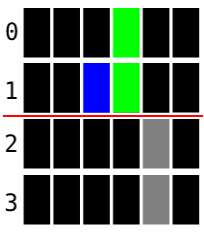
Based on the previous GLIR_PrintOVLine subroutine, if (Row1, Col) ==
(Row2, Col), i.e. arguments a1 and a2 are the
same, then it prints a single cell. Thus, the height of the bar is the
difference between the separator and the height of the bar. This also
works for negative elements but the computed height is a negative value.
For example, if the separator is located at row 1 and the height of the
bar is 0, then the bar will be a cell at row 1 (blue). If the separator
is located at row 1 and the height of the bar is 1, then the bar will be
printed from row 1 to row 0 (green). If the separator is located at row
1 and the height of the bar is -1, then the bar will be printed from row
2 to row 3 (grey).
For colors, GLIR uses the ANSI escape codes, which are a set of codes that can be used to change the color of the text or background of the terminal. GLIR abstracts away these ANSI escape codes and allow the user to simply select the desired color code from a 256-color lookup table:
| Standard colors | High-intensity colors | ||||||||||||||||||||||||||||||||||||||||||||||||||||||||||
|
|||||||||||||||||||||||||||||||||||||||||||||||||||||||||||
| 216 colors | |||||||||||||||||||||||||||||||||||||||||||||||||||||||||||
| 16 | 17 | 18 | 19 | 20 | 21 | 22 | 23 | 24 | 25 | 26 | 27 | 28 | 29 | 30 | 31 | 32 | 33 | 34 | 35 | 36 | 37 | 38 | 39 | 40 | 41 | 42 | 43 | 44 | 45 | 46 | 47 | 48 | 49 | 50 | 51 | ||||||||||||||||||||||||
| 52 | 53 | 54 | 55 | 56 | 57 | 58 | 59 | 60 | 61 | 62 | 63 | 64 | 65 | 66 | 67 | 68 | 69 | 70 | 71 | 72 | 73 | 74 | 75 | 76 | 77 | 78 | 79 | 80 | 81 | 82 | 83 | 84 | 85 | 86 | 87 | ||||||||||||||||||||||||
| 88 | 89 | 90 | 91 | 92 | 93 | 94 | 95 | 96 | 97 | 98 | 99 | 100 | 101 | 102 | 103 | 104 | 105 | 106 | 107 | 108 | 109 | 110 | 111 | 112 | 113 | 114 | 115 | 116 | 117 | 118 | 119 | 120 | 121 | 122 | 123 | ||||||||||||||||||||||||
| 124 | 125 | 126 | 127 | 128 | 129 | 130 | 131 | 132 | 133 | 134 | 135 | 136 | 137 | 138 | 139 | 140 | 141 | 142 | 143 | 144 | 145 | 146 | 147 | 148 | 149 | 150 | 151 | 152 | 153 | 154 | 155 | 156 | 157 | 158 | 159 | ||||||||||||||||||||||||
| 160 | 161 | 162 | 163 | 164 | 165 | 166 | 167 | 168 | 169 | 170 | 171 | 172 | 173 | 174 | 175 | 176 | 177 | 178 | 179 | 180 | 181 | 182 | 183 | 184 | 185 | 186 | 187 | 188 | 189 | 190 | 191 | 192 | 193 | 194 | 195 | ||||||||||||||||||||||||
| 196 | 197 | 198 | 199 | 200 | 201 | 202 | 203 | 204 | 205 | 206 | 207 | 208 | 209 | 210 | 211 | 212 | 213 | 214 | 215 | 216 | 217 | 218 | 219 | 220 | 221 | 222 | 223 | 224 | 225 | 226 | 227 | 228 | 229 | 230 | 231 | ||||||||||||||||||||||||
| Grayscale colors | |||||||||||||||||||||||||||||||||||||||||||||||||||||||||||
|
|||||||||||||||||||||||||||||||||||||||||||||||||||||||||||
In this visualizer all negative elements be colored red and all positive elements be colored green. Use color code 9 for red and color code 10 for green. Below is the formalized definition of the color function given an element:
$$color=\left\{ \begin{array}{ll} 9 & x\lt0 \\ 10 & x\gt0 \\ \end{array} \right.$$ where \(x\) is the given element.
The current element being inserted is highlighted in blue. Use color code 12 for blue.
Here are the steps to draw the array. The lab solution must implement
these in RISC-V in the draw function:
This is a visual lab. Running the main
visualizer.s file will run the actual visualizer. Thus, it
may be difficult to test the non-visual functions: max,
min, max_range, separator_pos,
and bar_height. The provided test_func.s file
contains code that invokes the non-visual functions on three different
test arrays. We have also provided the expected output for these
functions so that you can compare your output.
To run the test cases, simply run rars test_func.s in the
same directory where you have your code.
Here are the arrays that are being tested in
test_func.s and their expected values:
rars visualizer.s.
rars visualizer.s.
ssh into a lab machine. Instructions to access the
lab machines can be found
here. Follow the Linux/MacOS instructions.
rars visualizer.s.
The visualizer.s code contains a test array called
numArray, and its length called lenArray. You
may change the values in this array to test your code with different
arrays, and make sure to change the length of the array accordingly.
IMPORTANT: This array is only used for testing.
DO NOT load this array into your solution. For instance, do not
do la t0, numArray or lw t0, lenArray. The
grading harness does not use this array to grade your solution.
The solution must follow the register saving/restoring calling conventions.
The specification for this lab is divided into three parts. Start with Part 1, then move on to Part 2, and finally Part 3.
The solution for this assignment must implement the following functions:
max:
a0: pointer to array of numbersa1: length of array of numbersa0: the greatest value of the array of numbers
min:
a0: pointer to array of numbersa1: length of array of numbersa0: the smallest value of the array of numbers
max_range:
a0: pointer to array of numbersa1: length of array of numbersa0: the value of \(\max(range(a),\ \max(a)-0,\
0-\min(a))\)
separator_pos:
a0: pointer to array of numbersa1: length of array of numbersa0: the position of the separator given the array
of numbers
bar_height:
a0: pointer to array of numbersa1: length of array of numbersa2: target element valuea0: the bar height of the target elementdraw:
a0: pointer to array of numbersa1: length of array of numbersa2: index of element to be highlightedvisualize_sort:
a0: pointer to array of numbersa1: length of array of numbersnumArray and lenArray.
Assignments too short to be adequately judged for code quality will be given a zero.
draw procedure.max, min, and
max_range procedures.
bar_height and
separator_pos procedures.
Ensure that your solution works in the lab machines because it will be graded using the lab machines.
There is a single file to be submitted for this lab:
main label to this file..include "common.s".common.s file.All necessary instructions for completing this lab have been provided above. Below are just some additional information that may be interesting if you would like to learn more about some of the concepts we have talked about.
There are multiple other ways of displaying updates on the screen that the one we will be using for the lab, however, they are not appropriate in our case.
One simple method to display updates on the screen is to first clear the screen then draw the next frame onto the screen. This method may cause some flickering, becuase a computer screen refreshes many times a second while clearing and printing onto the terminal is a relatively slow process.
Another method is the batch and release method. This method collects a list of print jobs and then execute them all at once. Though this method should reduce the flickering issue, it can be too complicated and unnecessary for the purpose of this lab as we are only printing straight vertical lines.